Follow Us


© Copyright 2026 ArcTouch. All rights reserved.
© Copyright 2026 ArcTouch. All rights reserved.
App analytics help Midtown Athletic Club understand user experience, boost engagement, and drive growth
4 min. read - May 8, 2025
Get our newsletter in your inbox.
Setting goals, defining KPIs, and building a culture where it’s OK to fail are crucial steps to creating a mobile analytics strategy. Learn more.
Defining app KPIs can be as important as determining the right feature set in an app MVP. These KPIs that will help you determine if your app is successful.
We help companies of all sizes build lovable apps, websites, and connected experiences.

In the fitness industry, mobile apps are essential for driving customer loyalty and satisfaction. But without insight into how members use these apps, even well-designed experiences risk falling short. Luxury fitness leader Midtown Athletic Club recognized the importance of gaining deeper visibility into member behavior to continually improve its app.
ArcTouch designed and developed the Midtown Athletic Club app with integrated powerful analytics capabilities. This blog post highlights how app analytics provide actionable insights, enabling Midtown leadership to better understand their members’ engagement and strategically drive growth.
ArcTouch follows a structured process to create a data-driven platform for our clients to make informed product development decisions. Understanding Midtown's needs and objectives was the first step
During our product planning workshops, we studied how a mobile app could elevate the club experience for members while generating valuable business insights, including defining the business questions that needed answers. For Midtown, these questions centered around understanding how the app could boost member engagement, drive check-ins, impact customer lifetime value (CLV), and contribute to service category revenue. By clearly defining these questions first, we ensured that every analytics effort directly supported meaningful business goals, eliminating guesswork, increasing efficiency, and driving measurable improvements.
Once these questions were established, we created a taxonomy to organize the data collection in a logical way. This foundational work guided the design and development phases, where events were tracked according to key performance indicators (KPIs).
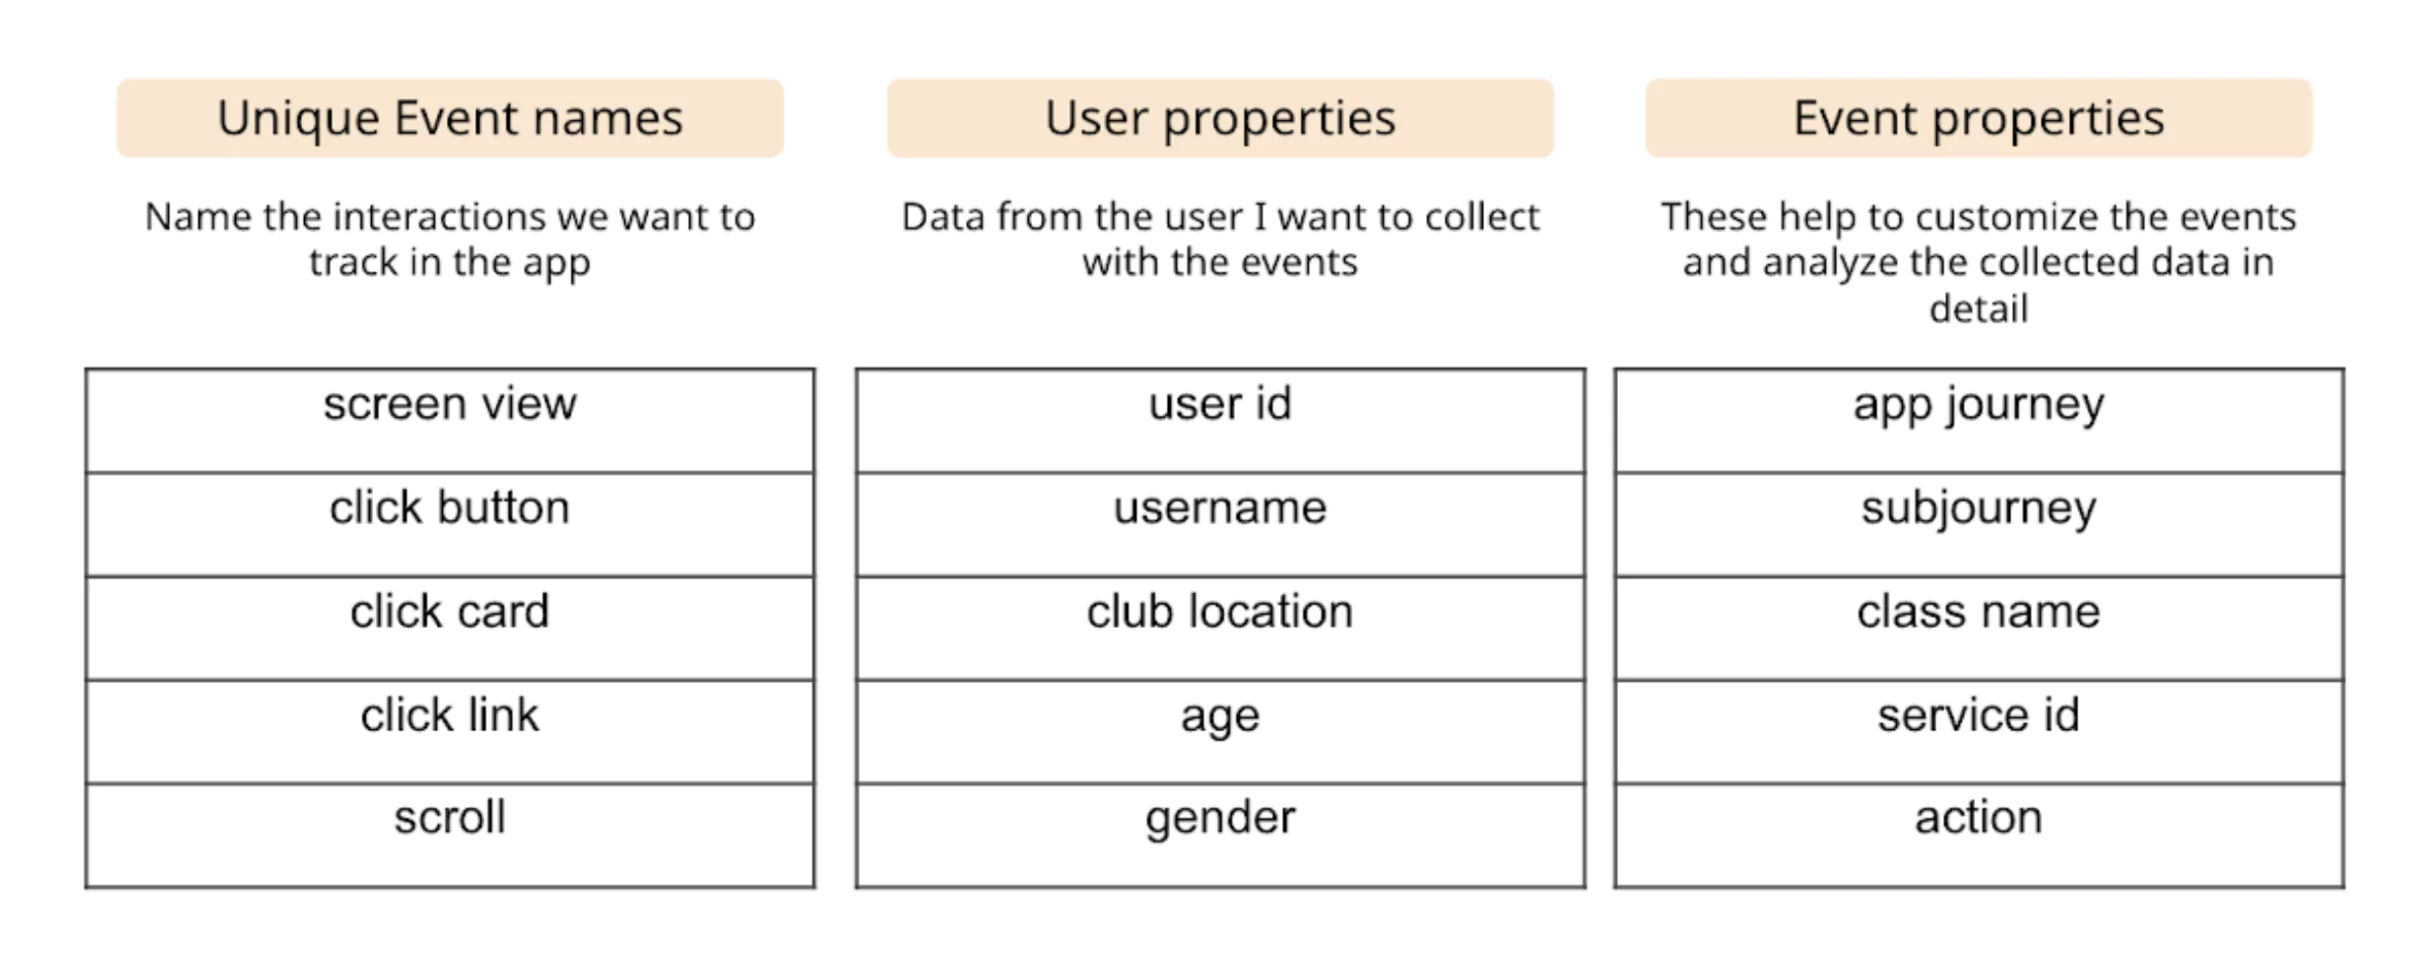
The data collection taxonomy defines the event names and properties to support the KPIs identified during product planning.
Data visualization was a critical component of our framework. By presenting data visually, we made it easier for Midtown to interpret the results and make informed product decisions.
To adapt our analytics framework to Midtown's project, we formulated specific business questions for each macro journey of the app. For example, given that scheduling classes is a primary service offered through the app, we asked, "What is the free class conversion by class type and studio?" These targeted questions allowed us to delve deeper into user behavior and preferences.
We organized the data using the established taxonomy and tracked user interactions within the app. We mapped each macro journey throughout the app to the actual UI designs, ensuring that key user actions and interactions can be tracked as events.
For example, events such as adding a class to a schedule are recorded and analyzed, providing granular insights into user behavior.
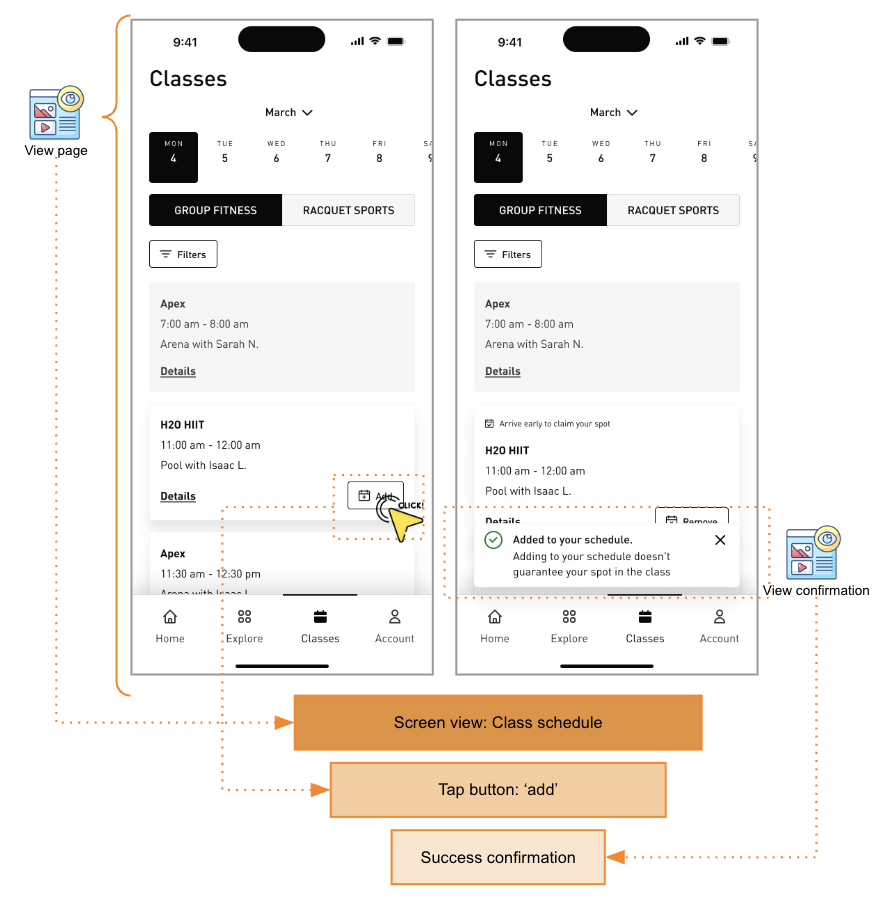
The app analytics framework maps specific business questions and KPIs to the user interface within the app.
The app monitors user interactions, such as when members add a class to their schedule (registered as an event labeled “tap button.” Detailed event properties are recorded, including the journey (“classes”), subjourney (“add_to_schedule”), class name “'H2O_Hit”), and action (“added to schedule”). In addition to these properties, we gather demographic properties like club location, age, and gender. This detailed approach to data collection provides insights into user behavior. These app analytics prove crucial in identifying cohorts that influence business KPIs and product targets. Analyzing these properties can provide actionable insights. For example, Midtown can determine the conversion rate for male members signing up for free classes, and then look for ways to boost those rates.
Data visualization is essential to this process because insights can remain buried without clear visuals. With clearly visualized data, Midtown can immediately pinpoint high-performing classes and uncover opportunities, such as enabling targeted initiatives to boost engagement. These detailed insights equip our clients to make informed decisions for future product enhancements.
Our work with Midtown highlights the power of following a structured process for defining, implementing, and using app analytics. We defined the key business questions, established a logical taxonomy for data collection, mapped events to KPIs and the user interface designs, and leveraged data visualization tools to unlock deep insights into customer behavior and preferences.
These insights enable Midtown to make informed decisions and tailor their services to meet the needs of its members. In today's competitive market, such data-driven strategies are essential for businesses that want to understand their customers better, enhance their offerings, and stay ahead of the competition.
Forward-thinking product leaders use analytics to make educated decisions about their product roadmap and to boost user engagement. ArcTouch can help you define and implement a plan to add analytics to your app.
Contact us for a free consultation today.
